A Study on the Role of Tableau in Simplifying Stock Market Data Interpretation at Cognifyz Technologies, Nagpur
Main Article Content
Abstract
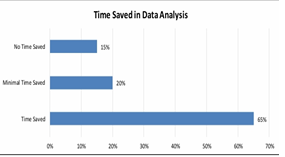
The effective interpretation of stock market data is critical for investors and analysts seeking informed decision-making. Tableau, a leading data visualization tool, simplifies the analysis of complex datasets by converting raw information into visually engaging and actionable insights. This study explores the role of Tableau in streamlining the interpretation of stock market data at Cognifyz Technologies, Nagpur. Emphasis is placed on the tool's ability to enhance analytical efficiency, improve real-time decision-making, and support predictive analysis. Key performance indicators, patterns, and trends are identified with ease, contributing to better investment strategies. The research employs a mixed-methods approach, combining qualitative interviews with industry experts and quantitative assessments of Tableau's impact on efficiency. Findings reveal significant improvement in understanding data patterns and reducing the time required for analysis, underlining Tableau's potential as a transformative asset for financial analysis. By leveraging Tableau's intuitive interface, businesses can achieve greater accuracy and reliability in interpreting stock market trends. This study contributes to the existing body of knowledge by demonstrating how modern data visualization tools can revolutionize traditional methods of financial data analysis and foster strategic advancements in the stock market sector.
Downloads
Article Details

This work is licensed under a Creative Commons Attribution-NoDerivatives 4.0 International License.
